Important update: federal use of the social cost of carbon has been withdrawn
Earlier versions of this article said a federal working group was preparing an updated social cost of carbon estimate. That is no longer the case. In January 2025, Executive Order 14154 disbanded the Interagency Working Group that produced the federal estimates and withdrew its guidance. In May 2025, the White House told federal agencies not to monetize climate damages in rules and permits unless a statute plainly requires it, and EPA’s 2025 proposal to repeal power plant carbon standards did not put a dollar value on climate damages. The 2023 EPA estimate of $190 per ton, covered below, is no longer being used in federal rulemaking. Canada adopted that 2023 figure for its own use, and the underlying economic research remains widely available. This is a fast moving area, so check current federal guidance before relying on any specific figure.
Human activities are placing a strain on Earth’s natural carbon cycle. But it’s not only the carbon cycle we need to worry about. The overworked carbon cycle is changing our planet. Global warming and climate change contribute to many negative impacts, including social ones. From property damage to health consequences, future generations are at risk due to our actions today. For these reasons, we must ask ourselves an important question: What is the social cost of carbon?
Economists and scientists have worked together to create a tool called the social cost of carbon, which puts a dollar figure on the damage caused by one more ton of carbon dioxide. Governments in several countries have used the figure to weigh policies designed to limit the impacts of carbon emissions.
This article will explain the natural carbon cycle and how human activity affects it. Then, we’ll explore what aspects of our world are changing. After that, we’ll look into the social cost of carbon, which helps put a price on the damage from climate change, and where it stands today. Finally, we will look at what role carbon offsetting can play.
Key takeaways
- Carbon moves between rocks, the ocean, the atmosphere, plants, and soil. Humans now add about 42 billion tonnes of CO2 a year, on the order of 100 times what volcanoes emit.
- Atmospheric CO2 is about 52% above preindustrial levels. The ocean and land absorbed about 29% and 21% of human emissions over the past decade, and both sinks are weakened by warming.
- The social cost of carbon estimates the dollar value of the damage from one more ton of CO2. U.S. federal estimates have ranged from about $21 per ton in 2010 to $190 per ton in 2023.
- Since 2025, the federal government has stopped using the social cost of carbon in most rulemaking, though Canada and many researchers still use similar estimates.
- The social cost of carbon is not the same as the price of a carbon credit. Credits fund a verified amount of reduction or removal from a specific project, and they work alongside cutting your own emissions.
The Carbon Cycle and Climate Costs in 2026: The Latest Data
The numbers behind the carbon cycle have moved since this article was first written. Here is where they stand.
2026 data snapshot
- Emissions: The Global Carbon Budget 2025 projects total human CO2 emissions of about 42.2 billion tonnes in 2025, made up of a record 38.1 billion tonnes from fossil fuels and about 4.1 billion tonnes from land use change.
- Atmospheric CO2: Concentrations are about 425 parts per million for 2025, roughly 52% above the 278 parts per million of 1750. The Mauna Loa Observatory recorded a monthly peak of 430.5 parts per million in May 2025, which runs higher than the global annual average.
- Natural sinks: Over the past decade the ocean absorbed about 29% of human CO2 emissions and land absorbed about 21%. Climate change is reducing how well these sinks work, and the researchers estimate it has added about 8.3 parts per million of CO2 to the atmosphere since 1960.
- Costs: The United States recorded 23 separate weather and climate disasters costing at least $1 billion each in 2025, with total damages near $115 billion, according to Climate Central. The January 2025 Los Angeles wildfires alone caused about $61.2 billion in damage.
What Is the Natural Carbon Cycle?
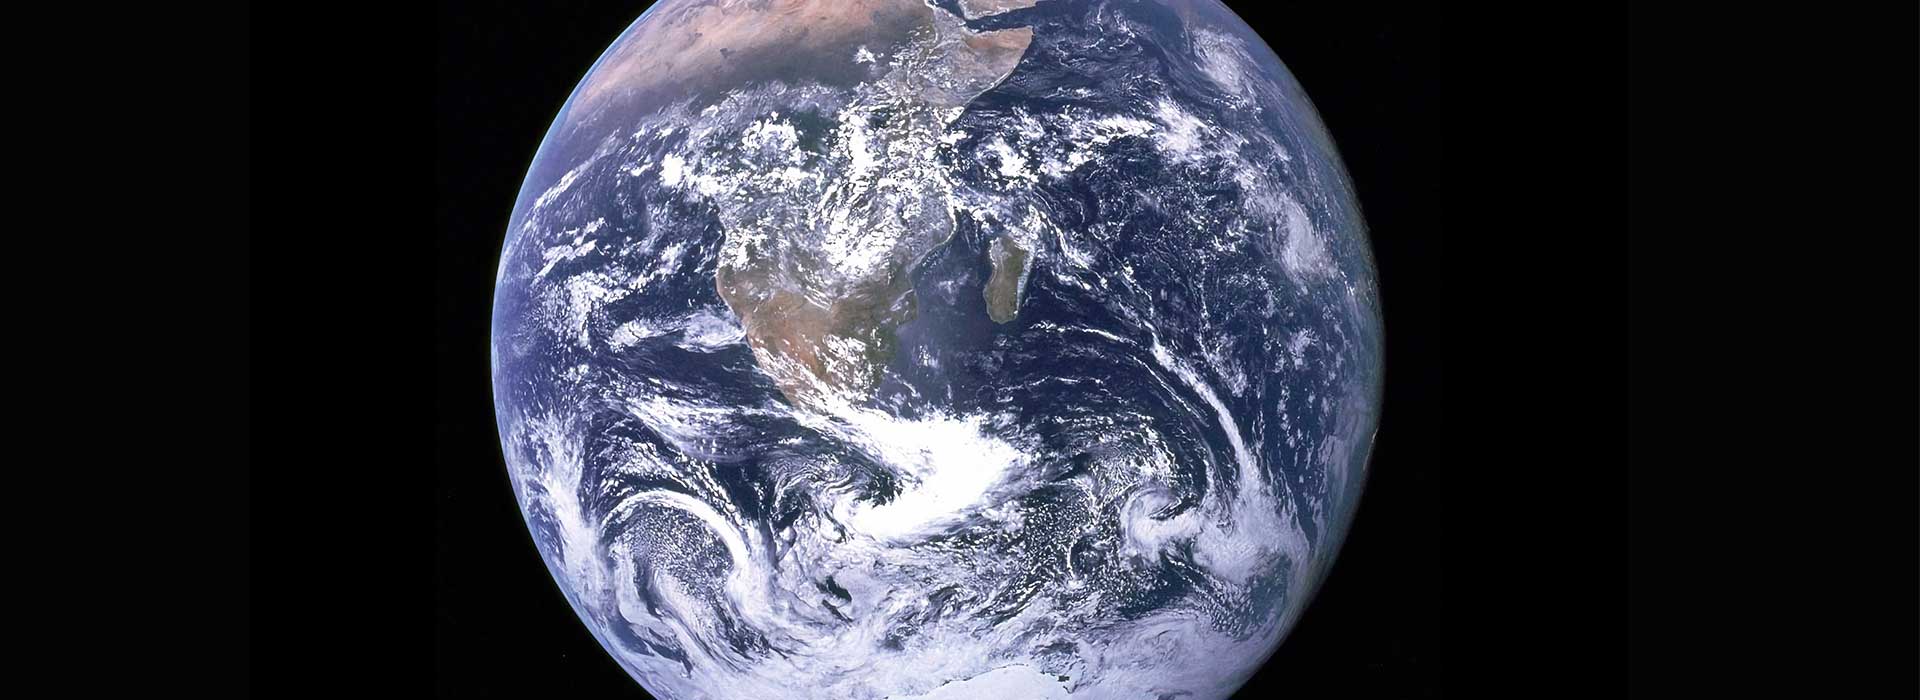
Carbon is stored throughout our planet. It can be found in the atmosphere, oceans, living organisms, and sedimentary layers. The amount of carbon on Earth is more or less the same amount that has always been here. How, then, is carbon contributing to the global threat of climate change? Let’s take a look at the natural carbon cycle and how it works to understand the role humans play in shifting carbon levels.
Of all the carbon stored on Earth, 65,500 billion metric tons are found in rocks, and the rest is located in the ocean, atmosphere, plants, soil, and fossil fuels. Over time, the carbon shifts from one of these containers to another. Some of the changes take a long time, while others occur rapidly. Earth’s temperature is regulated through this natural cycle.
One natural way carbon is released from rocks into the atmosphere is through volcanic eruptions. NOAA’s Climate.gov puts volcanic emissions at roughly 300 million metric tons of CO2 per year, with estimates ranging from about 150 to 450 million.
Human carbon dioxide emissions from burning fossil fuels and making cement reached about 38 billion metric tons in 2025. That is on the order of 100 times the natural amount coming from volcanic activity. The massive quantity of carbon released due to human activity strains the natural carbon cycle. More carbon is released into the atmosphere than absorbed through natural processes, leading to global warming and climate change.
The fastest way carbon dioxide is removed from the atmosphere is through plants and phytoplankton. These organisms absorb carbon dioxide from the atmosphere into their cells to create energy. Plant life plays such a significant role in atmospheric carbon reductions that carbon levels increase regionally in the winter when more plants are decaying than those that are growing and drop in the spring when plants begin to grow again.
The intense involvement of plants in carbon sequestration supports activities like tree planting and forest management as positive human endeavors that can aid in reducing global carbon levels.
How Does Human Activity Affect the Carbon Cycle?

Burning fossil fuels is the primary human activity responsible for carbon and other greenhouse gas emissions into the atmosphere. In the United States, the industry that emits the most carbon is transportation, at about 28% of U.S. greenhouse gas emissions, followed by electricity production at about 24%, then industry and commercial and residential energy use. Human activities like these contribute to increasing carbon dioxide levels, burdening the natural carbon cycle.
Other human activities that contribute to changes in the carbon cycle are land use changes. Deforestation for crops or urban development removes trees that are essential in the mitigation of carbon from the atmosphere. Trees store carbon in their wood, stems, and leaves and are replaced with vegetation that absorbs little carbon or urban developments that absorb no carbon. Land use change released about 4.1 billion metric tons of CO2 in 2025 (roughly 1.1 billion tons of carbon), slightly less than the year before, according to the Global Carbon Budget.

Human activities like these have resulted in a dramatic increase in carbon dioxide levels since the Industrial Revolution. Atmospheric carbon dioxide has climbed from about 278 parts per million in 1750 to roughly 425 parts per million in 2025, about 52% above preindustrial levels and the highest concentration in at least 800,000 years of ice core records.
Our actions have significant consequences on our planet. As we continue to burn fossil fuels and alter how we use the land, the carbon cycle cannot keep pace with the amounts of carbon emitted each year.
What Happens When the Carbon Cycle Is Changed?
As human activity interferes with the natural carbon cycle, we are beginning to see changes in many areas of our planet. These changes can be found in natural containers of carbon: the atmosphere, the ocean, and the land.
Each of these containers is involved with one another in a carbon exchange. When one becomes saturated, another absorbs the excess carbon. However, the absorption of excess carbon can have negative consequences on the state of ecosystems. Let’s look into each of these to observe the changes they are experiencing.
The Atmosphere
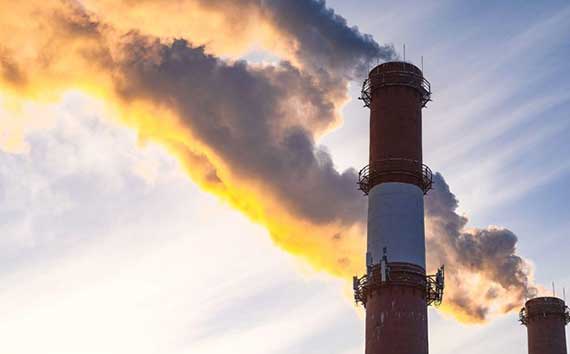
Carbon dioxide and other greenhouse gases, like methane, are responsible for trapping heat, which keeps it from escaping our atmosphere into space. A certain presence of these gases is necessary for Earth to stay warm enough to support life. Carbon dioxide alone is responsible for 20% of Earth’s greenhouse effect, so when concentrations increase due to human activity, global warming effects are profound.
Global warming causes extreme weather patterns like increased drought and intense storms. Sea levels are rising due to melting ice caps, and crops are becoming more challenging to grow in some regions. Ecosystems face severe changes in stable climate that could result in permanent damage. All these adverse effects of global warming will result in expensive property damage, loss of life, and serious health risks to humans worldwide.
The Ocean
The ocean is experiencing changes due to increasing atmospheric carbon levels. The sea is one of Earth’s natural carbon sinks, and it absorbs carbon from the atmosphere when there is a surplus. Over the past decade the ocean has absorbed about 29% of human CO2 emissions, making it the largest natural sink, and its acidity has risen by roughly 30% since the Industrial Revolution. When carbon interacts with ocean water, carbonic acid is formed and increases acidity levels in the ocean.
Increasing ocean acidity poses a threat to marine life. Ocean temperatures are also experiencing warming due to rising global temperatures. Increasing temperatures and acidity both threaten the health of ecosystems in our oceans.
The Land
Plants and soils on land absorbed about 21% of human CO2 emissions over the past decade, according to the 2025 Global Carbon Budget, a smaller share than earlier estimates suggested. While plants thrive in carbon rich environments, global warming has reduced plants’ ability to take advantage of the carbon rich atmosphere.
Increasing temperatures and drought have caused plants to slow their growth in the summer months in the Northern Hemisphere. What is more, plants need nutritious soil to grow. As temperatures increase, soil fertility decreases, meaning plants do not have the nutrients necessary to continue growing and absorbing carbon dioxide.
What Is the Social Cost of Carbon?
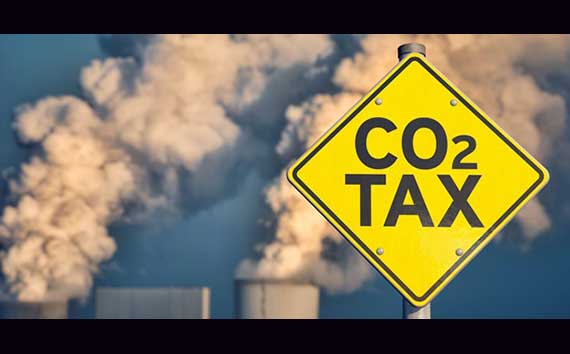
The social cost of carbon (SCC) is an estimate, in dollars, of the damage caused by emitting one more ton of carbon dioxide. It works by projecting the future costs of climate related damages and converting them into today’s dollars. Two choices drive most of the difference between estimates: the discount rate, which sets how much weight future damages get compared with costs today, and whether damages are counted worldwide or only inside the United States. A lower discount rate counts future harm more heavily and produces a higher figure.
The costs of climate change include property damage, human health consequences, and impacts on economic growth. Decision makers in the United States and Canada have used SCC estimates to weigh rules on issues like vehicle fuel economy and power plant emissions, and to limit some of the liability placed on future generations, who would otherwise have to deal with these damages. Let’s cover each of these costs and then look at how the figure has been used.
Property Damage
As global temperatures warm and the climate changes, extreme weather and sea level rise threaten property. These dramatic changes cause significant amounts of property damage, which places a strain on economies. In 2025, for example, the United States recorded 23 separate weather and climate disasters costing at least $1 billion each, with total damages near $115 billion. The January 2025 Los Angeles wildfires alone caused about $61.2 billion in damage. Communities also lack the water storage infrastructure to handle droughts.
Human Health Consequences
Clean air and drinking water, food, and shelter are all threatened in communities worldwide. The World Health Organization expects climate change to cause about 250,000 additional deaths per year between 2030 and 2050 from causes like malnutrition, malaria, diarrhea, and heat stress, and estimates direct health damage costs of $2 billion to $4 billion per year by 2030.

Economic Growth Impacts
Scenario modeling from the Swiss Re Institute in 2021 found that if global temperatures rise by 3.2 degrees C (5.76 degrees F) by 2050, the global economy could see an 18% decrease in GDP. Nations that are less apt to experience extreme weather are likely to be least affected by economic impacts. Countries that do not have abundant resources will struggle as global temperatures increase. If Paris Agreement goals are met (warming held below 2 degrees C), the same modeling puts the loss at about 4%, dramatically reducing the economic cost of climate change. These are modeled scenarios rather than forecasts, and real outcomes will depend on the path emissions actually take.
How the Social Cost of Carbon Has Been Used
The federal government first published an SCC estimate in 2010, at about $21 per ton of carbon dioxide, after an Interagency Working Group (IWG) of federal economists and scientists was formed in 2009. The figure was updated several times. In 2021, an interim estimate set it at $51 per ton using a 3% discount rate. In November 2023, EPA published an updated central estimate of $190 per ton for 2020 emissions using a 2% discount rate, rising to $230 by 2030 and $308 by 2050. These values were used as the basis for climate policy decisions on issues like vehicle fuel economy standards and power plant emission reductions, and Canada adopted the updated EPA figure in 2023.
That changed in 2025. Executive Order 14154, signed on January 20, 2025, disbanded the IWG, withdrew its estimates, and directed EPA to consider removing the SCC from federal permitting and regulatory decisions. White House guidance in May 2025 then told agencies not to use a social cost of greenhouse gas metric unless a statute plainly requires it, and EPA’s June 2025 proposal to repeal power plant carbon standards left climate damages out of its cost and benefit analysis.
People disagree about this. The administration and the Department of Energy’s Climate Working Group have argued that SCC estimates depend on uncertain assumptions and should not drive rules. Many economists who helped develop the tool say the method is well established and that leaving it out means climate damages get no weight in the analysis. Brian Prest of Resources for the Future said that adding social cost figures could raise the net costs of the power plant repeal by potentially hundreds of billions of dollars.
The purpose of developing SCC estimates is to help account for burdens that would otherwise fall on future generations because of actions taken today. Measuring the socioeconomic effects of climate change can give policymakers data when they weigh energy policies that could reduce climate damages. A carbon tax is one policy concept that relies on this kind of estimate.
Understanding the economics of climate change, along with the human risks, is essential for the future. Whether or not a government uses an official figure, the underlying numbers compiled by economists and climate scientists can help policymakers and businesses weigh the tradeoffs of emitting more carbon.
Is the Social Cost of Carbon the Same as the Price of a Carbon Credit?
No. They measure different things. The social cost of carbon is an estimate of the damage society bears when one more ton of CO2 is emitted. The price of a carbon credit is what a buyer pays for one verified ton of emission reduction or removal from a specific project, and it reflects what that project costs to run, its quality, and market demand.
The two numbers can be far apart. Federal SCC estimates have run from about $21 to $190 per ton. In the voluntary carbon market, the broad average price has been roughly $4 to $6 per ton, while higher rated credits can cost $15 or more per ton depending on the project type. The gap does not mean either figure is wrong, since one is a damage estimate and the other is a market price.
It also means buying carbon credits does not pay off or settle the social cost of your emissions. A credit funds a verified amount of reduction or removal elsewhere, and it works best alongside cutting your own emissions first.
How Can Carbon Offsetting Help?
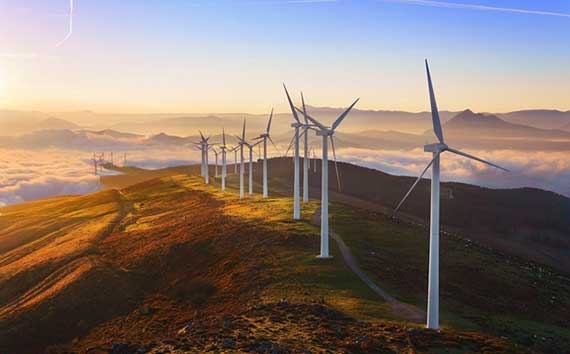
Human caused changes to the natural carbon cycle are certainly having an effect on global temperatures. There are methods available today that can play a role in limiting the effects of climate change. One option you can take part in today is carbon offsetting.
Carbon offsetting is one way to get involved in reducing human impact on the natural carbon cycle. Offsets fund projects that reduce or remove greenhouse gases. Terrapass’s Global Portfolio includes reforestation, REDD+ forest conservation, landfill gas capture, orphan oil well closure, industrial emission reduction, and residential solar installation, with projects verified under standards such as the Verified Carbon Standard, American Carbon Registry, Climate Action Reserve, and Gold Standard.
When you purchase carbon offsets from Terrapass, your purchase funds a specific, verified amount of emission reductions or removals through projects like these. Offsets work alongside, not instead of, cutting your own emissions. A simple way to start is to calculate your footprint with the carbon footprint calculator, reduce what you can, and then offset what remains.
FAQ: The Carbon Cycle and the Social Cost of Carbon
What is the carbon cycle?
The carbon cycle is the movement of carbon between rocks, the ocean, the atmosphere, plants, soil, and fossil fuels. The total amount of carbon on Earth stays roughly the same, but human activity is moving carbon from fossil fuels and forests into the atmosphere faster than natural processes can absorb it.
What is the social cost of carbon?
It is an estimate, in dollars, of the damage caused by emitting one more ton of carbon dioxide, based on projected costs like property damage, health effects, and lost economic growth, converted into today’s dollars.
How much is the social cost of carbon?
It depends on the method. The U.S. federal estimate was about $21 per ton in 2010, an interim $51 per ton in 2021, and $190 per ton in EPA’s 2023 update for 2020 emissions. Differences come mainly from the discount rate and whether damages are counted globally or only inside the United States.
Does the U.S. government still use the social cost of carbon?
Not in most rulemaking. Executive Order 14154 disbanded the Interagency Working Group in January 2025, and White House guidance in May 2025 told agencies not to use the metric unless a statute plainly requires it. Canada adopted the 2023 EPA figure.
Is the social cost of carbon the same as a carbon credit price?
No. The social cost of carbon estimates damage per ton of emissions, while a carbon credit price reflects the cost and market value of a verified ton of reduction or removal from a project. Buying a credit does not settle the social cost of your own emissions.
How much CO2 do humans emit compared to volcanoes?
Fossil fuels and cement released about 38 billion tonnes of CO2 in 2025, on the order of 100 times the roughly 300 million tonnes volcanoes emit in a typical year.
How much carbon do the ocean and land absorb?
Over the past decade the ocean absorbed about 29% of human CO2 emissions and land absorbed about 21%, according to the Global Carbon Budget 2025. Warming is reducing how well both sinks work.
Understanding the Social Cost of Carbon Is the First Step
After having gone over the natural carbon cycle and how it works, you have the information needed to understand the impact humans have on the environment as a whole. The changes we see in the world around us may appear daunting at times, but with tools like social cost of carbon estimates to inform policy, and with action from governments, businesses, and individuals, we can take meaningful steps toward protecting the planet and the life in it. Honest measurement, including setbacks like record emissions in 2025, is part of moving in the right direction.
Estimate your emissions with the carbon footprint calculator, then see Terrapass’s carbon offsets for individuals to fund verified emission reductions for what you cannot yet cut.
Sources for the 2026 data:
Global Carbon Budget 2025, CSIRO summary and LMU summary
NOAA Climate.gov, volcanoes and human CO2 emissions
Climate Central, 2025 U.S. billion dollar disasters
Harvard Environmental and Energy Law Program, social cost of carbon tracker
Earth911, history of the social cost of carbon
E&E News, May 2025 White House guidance
Resources for the Future, EPA power plant analysis
Brought to you by terrapass.com